The User Interaction Dashboard provides an overview of the most common day-to-day tasks performed in Avanan:
- Handling Quarantine Restore Requests
- Handling Phishing emails reported by end users
For more information on how to handle these tasks, see User Reported Phishing.
To access the User Interaction Dashboard, go to User Interaction > Dashboard.
The User Interaction Dashboard has these widgets:
| Widget Name |
Description |
| Reported Phishing |
Shows the number of phishing emails reported by end users.
- Pending - Shows the number of open reports that are not yet handled by help desk.
- Processed - Shows the number of reports that are handled by help desk.
- Quarantined - Shows the number of emails quarantined by help desk from the user reported phishing emails.
- Dismissed - Shows the number of emails dismissed by help desk from the user reported phishing emails.
|
| Restore Requests |
Shows the number of quarantine restore requests received from the end users.
- Pending - Shows the number of open requests that are not yet handled by help desk.
- Processed - Shows the number of restore requests that are handled by help desk.
- Approved - Shows the number of requested emails that are released from quarantine, either by help desk or by an end user.
- Dismissed - Shows the number of requests that are rejected by help desk.
- Released by user - Shows the number of quarantined emails released by the end users themselves.
Note - This is possible only if you configured the workflow in the policy to allow the end user to restore the email. See Threat Detection Policy workflow.
- Released by Admin - Shows the number of requested emails that are released from quarantine by help desk.
|
| SLA Trend |
Shows the SLA trend line for the amount of time it took for the help desk to handle requests/reports on a daily basis.
- The chart includes a SLA line, meant to mark the required SLA in your organization, so that you can easily see if you meet your SLA or not.
- The default value for the SLA is 30 minutes. To configure it, click the settings icon at the top of the dashboard window.
|
| User Trend |
Shows the trend line of different requests/reports and how they are handled.
|
| User Events |
Shows the list of recent requests reported by the end users.
|
| Top Users |
Shows the list of top requesting/reporting users in your organization.
|
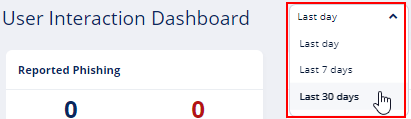
Extending the Time Frame of the Analytics
By default, the User Interaction Dashboard shows analytics for the last day.
To view analytics for extended time periods, select a time frame from the top of the dashboard.