


When you sign up for Avanan, you know that you're going to get the best email and cloud security on the market. With Avanan, end-users see a 99.2% reduction in phishing emails reaching the inbox.
That's great, but how will implementing it affect life for end-users and for admins?
Though Avanan is pretty much endlessly customizable, this is a good overview of what to expect when you start using the service.
(Note: These images are taken from our demo environment.)
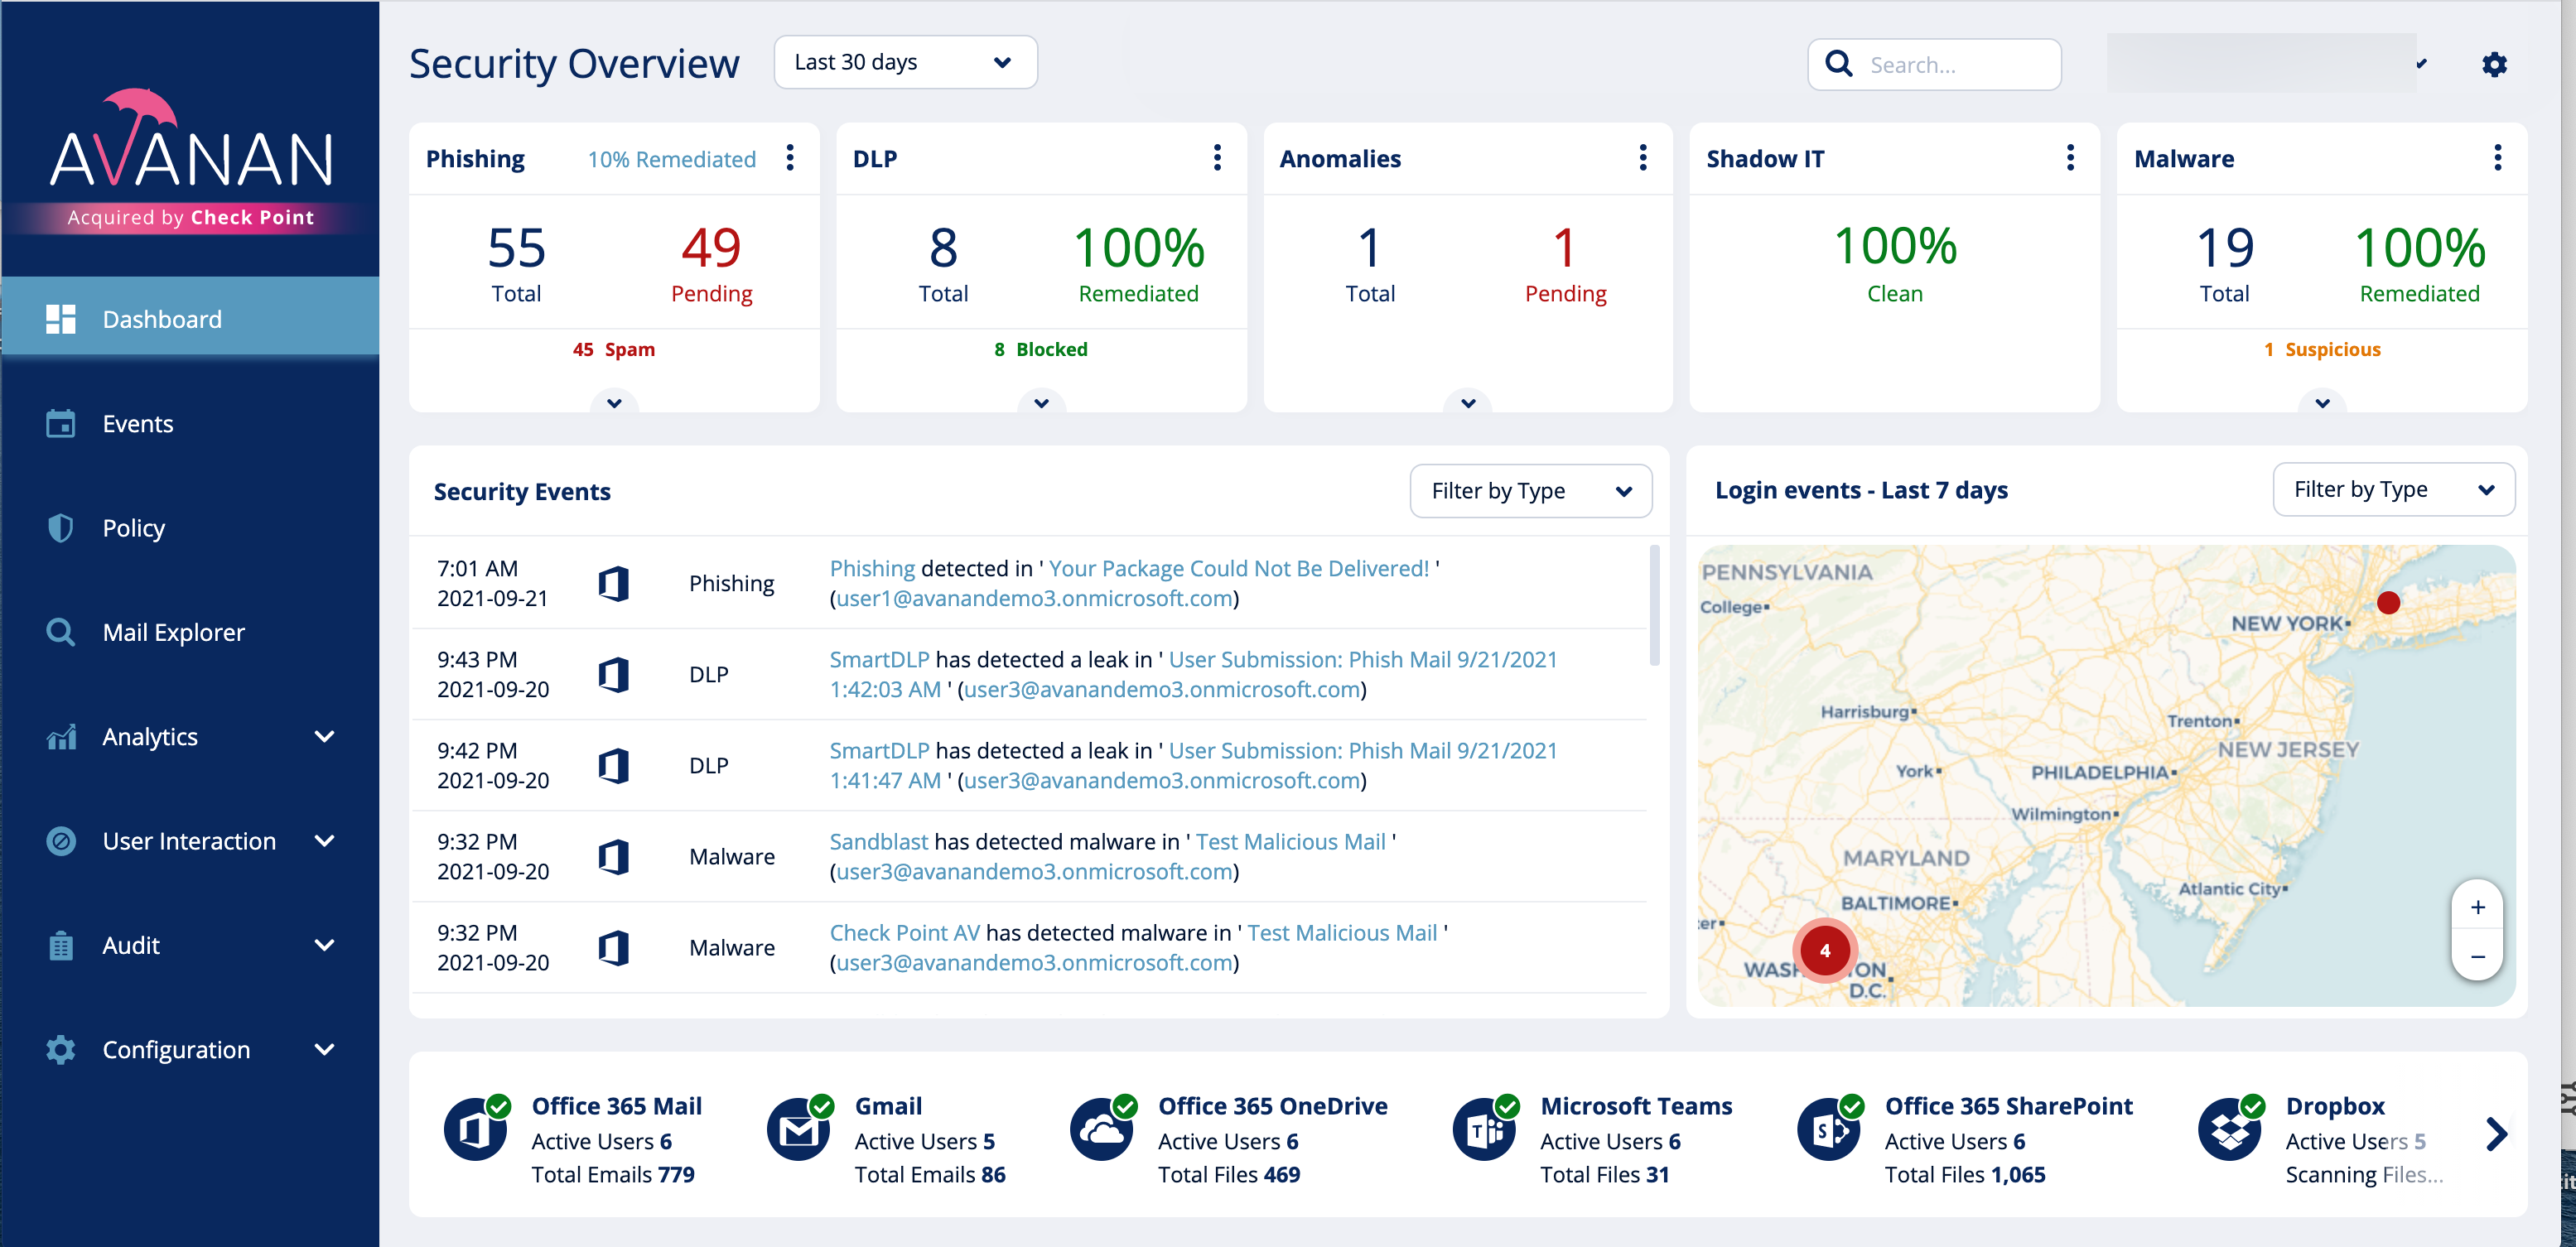
The Dashboard
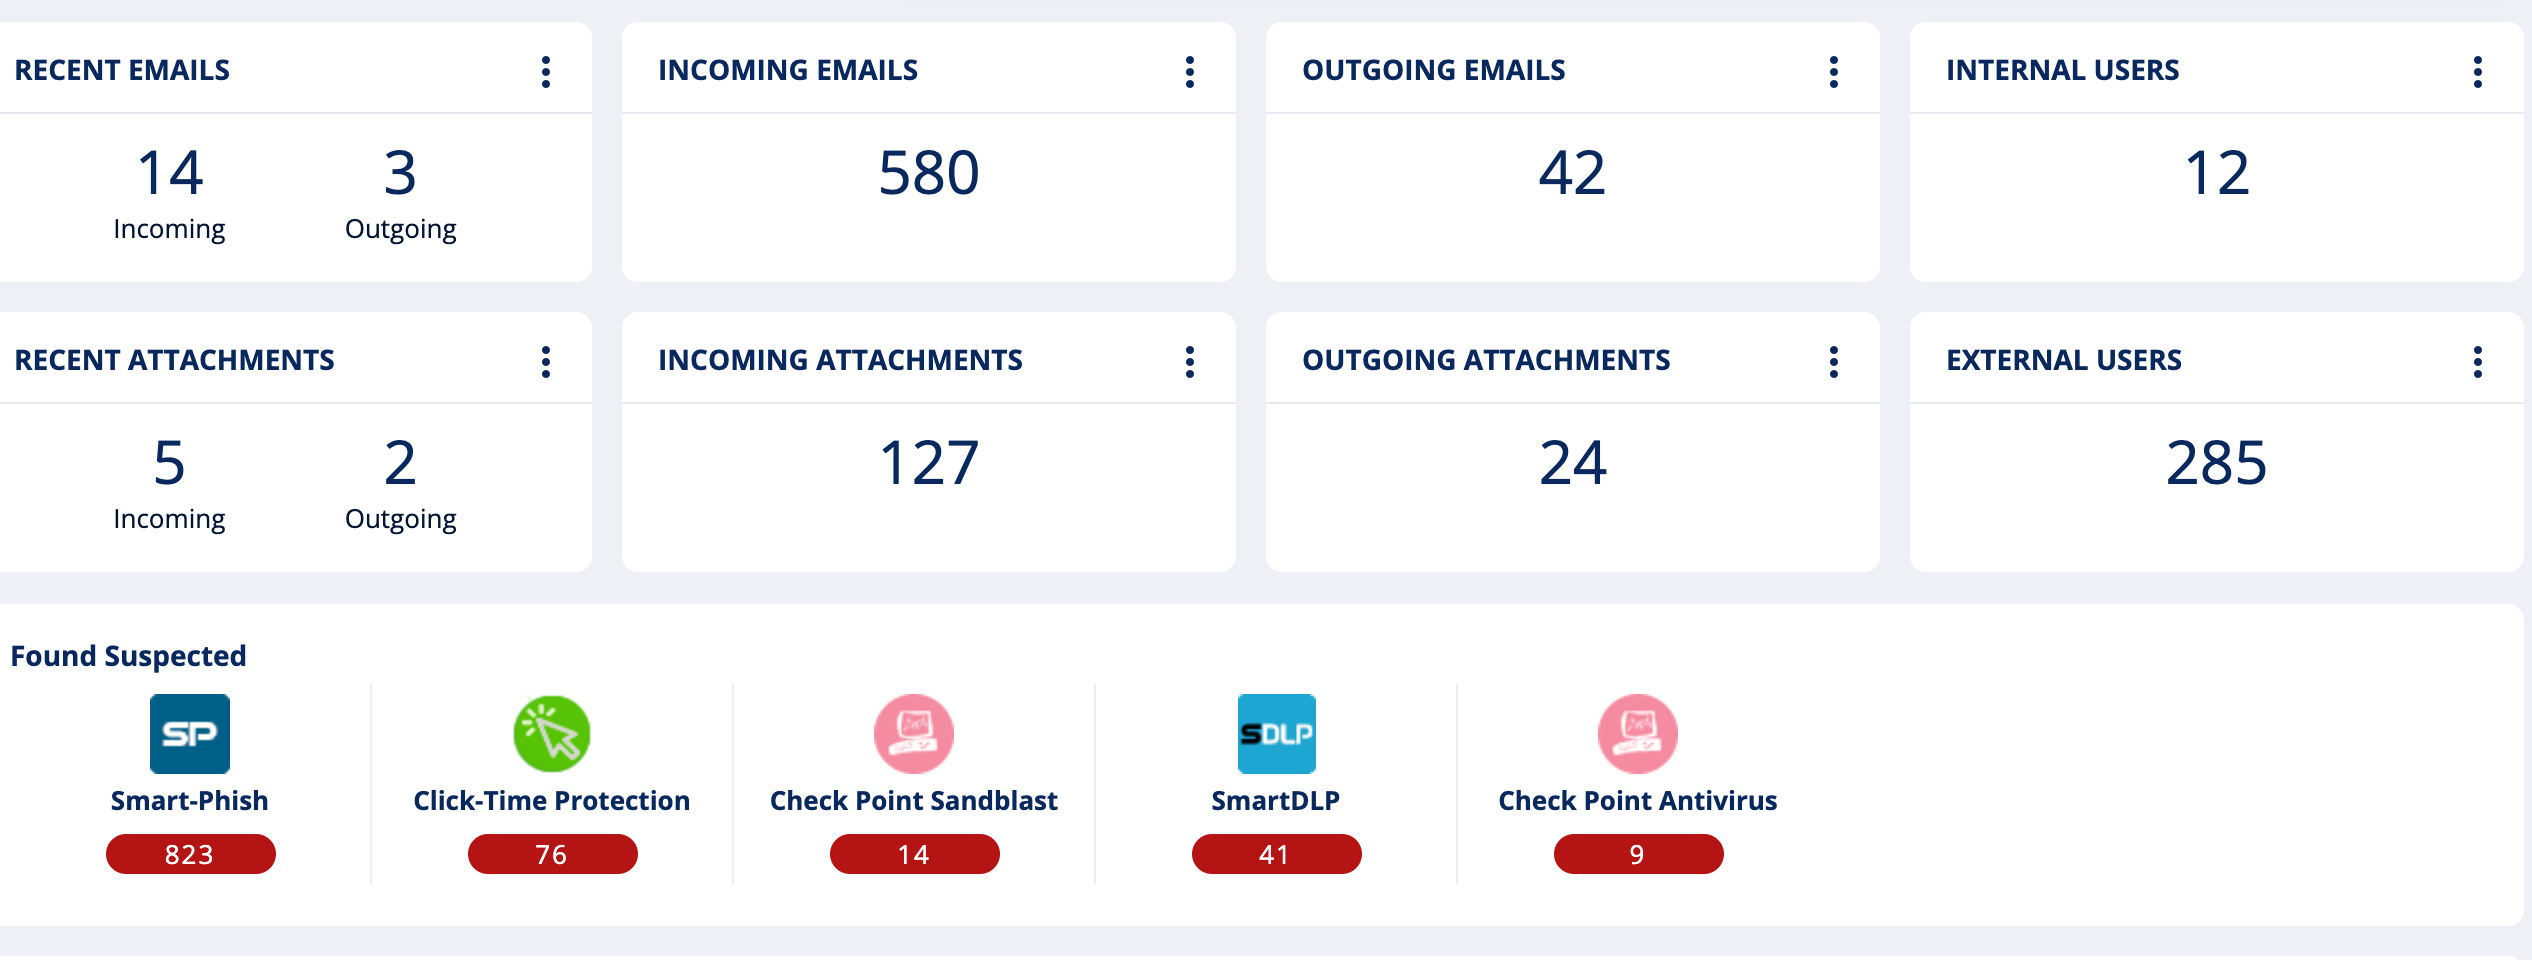
This is the Avanan dashboard. You'll see all your security at a glance. Notice the different stats, events for all your security and more. This is a great way to see everything in one single pane of glass.
The Email Profile
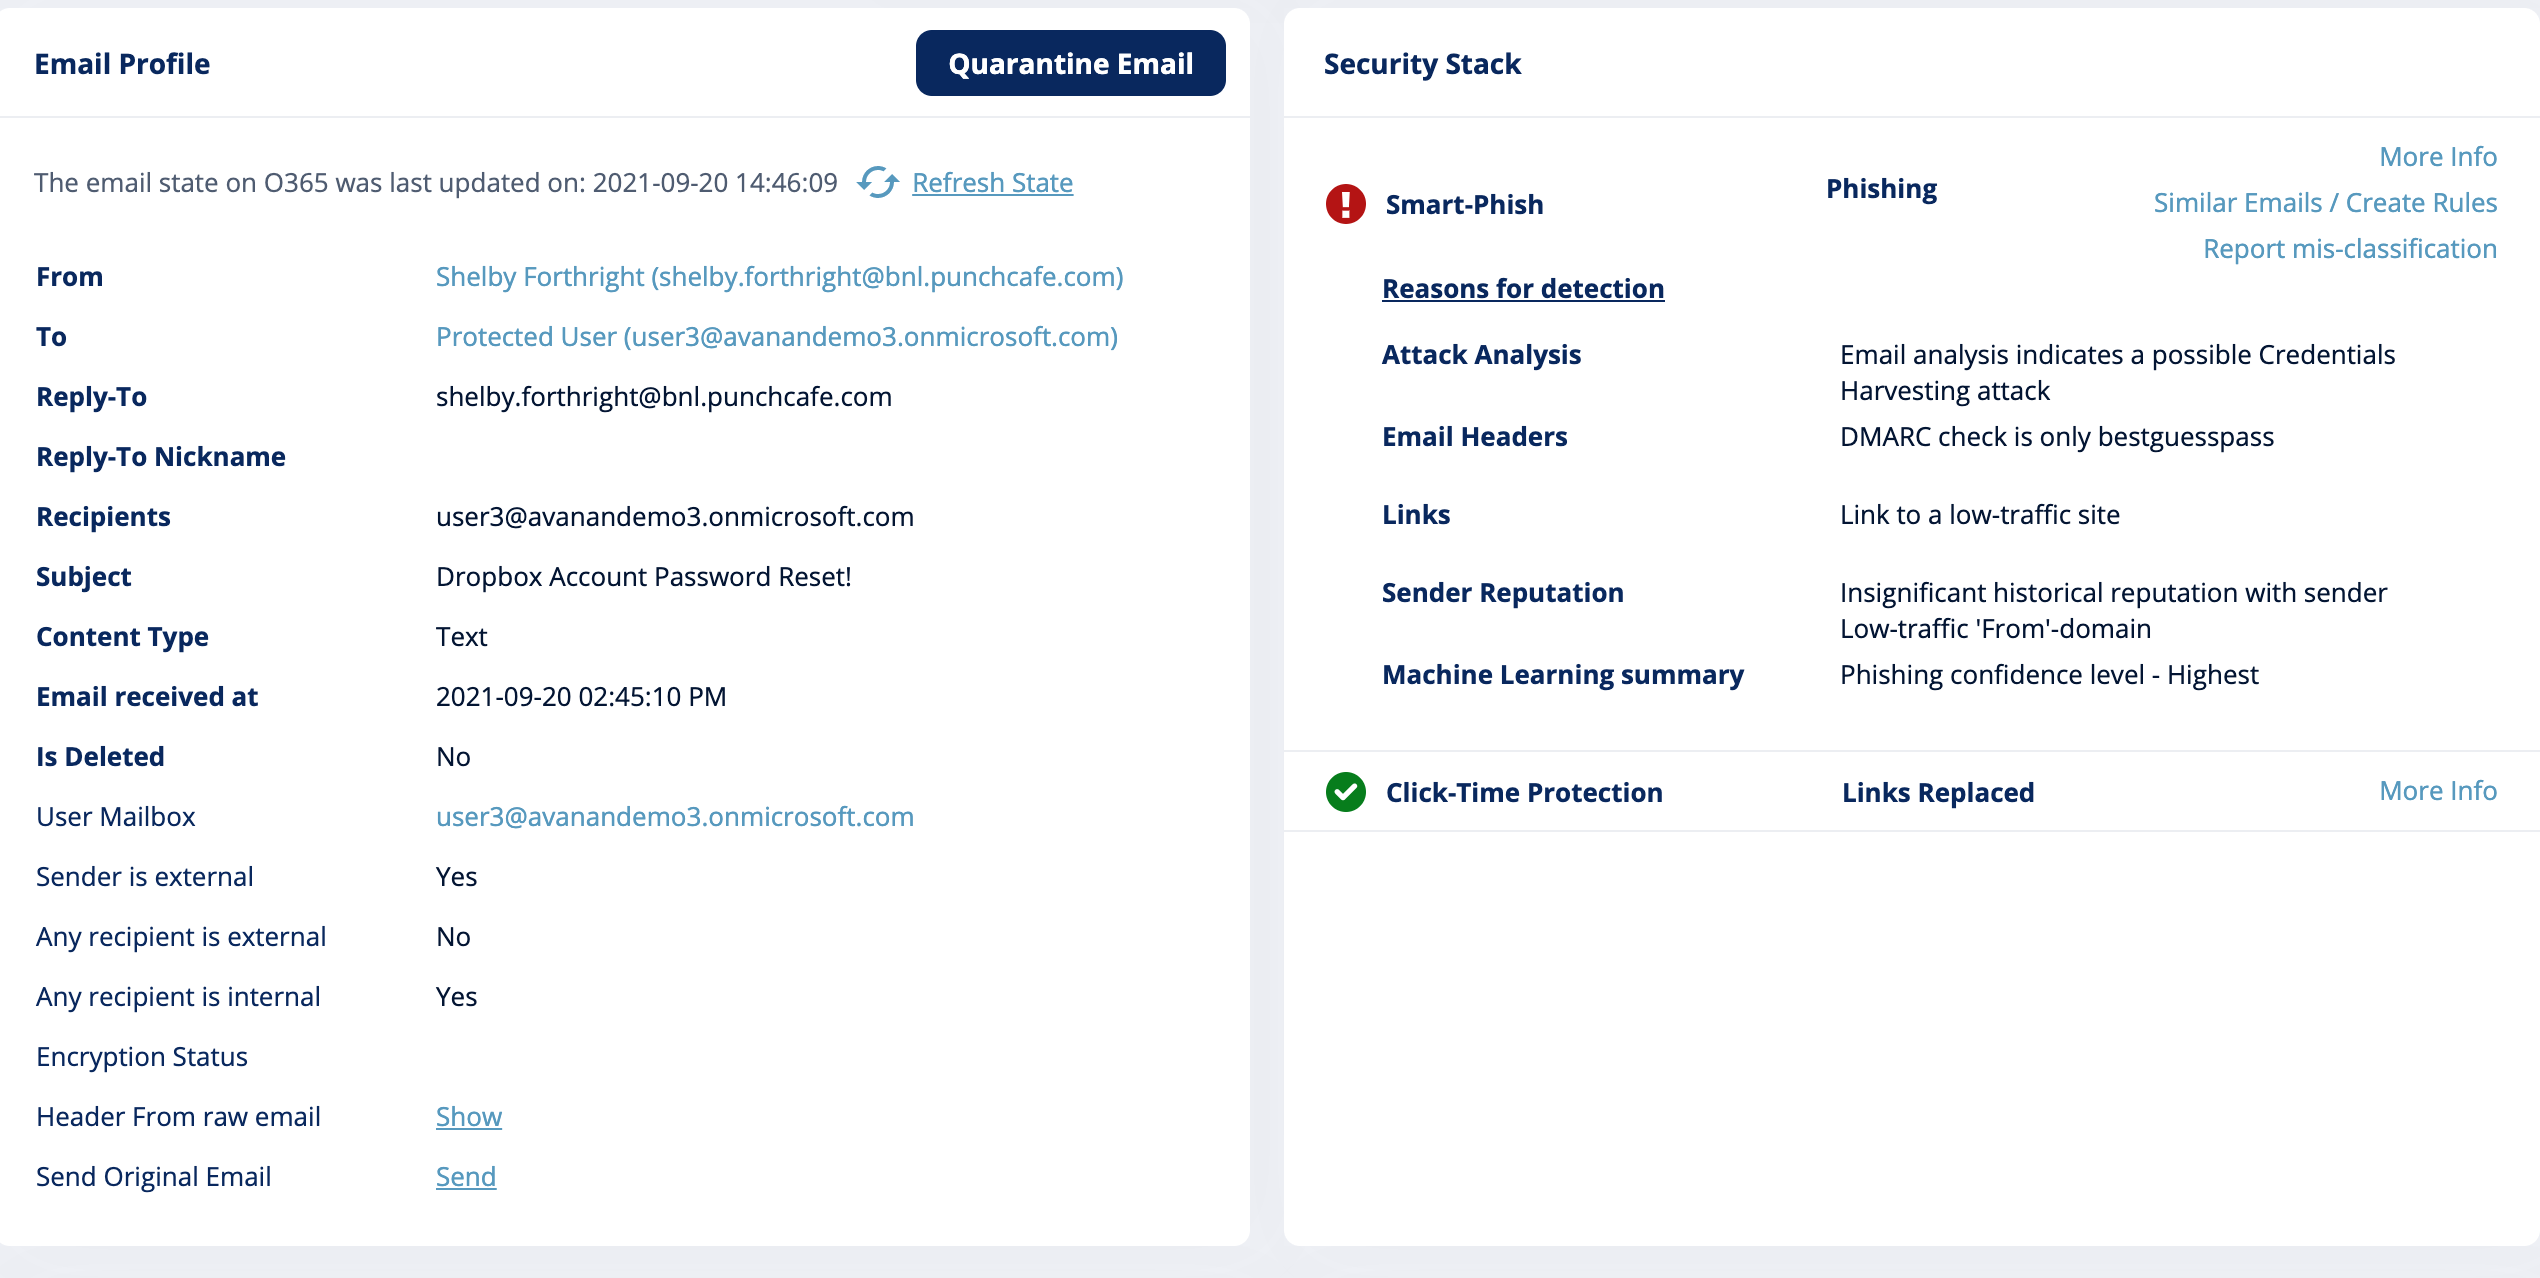
This is what the analysis of an email looks like. You'll see how Smart Phish ruled on the email, as well as other details.
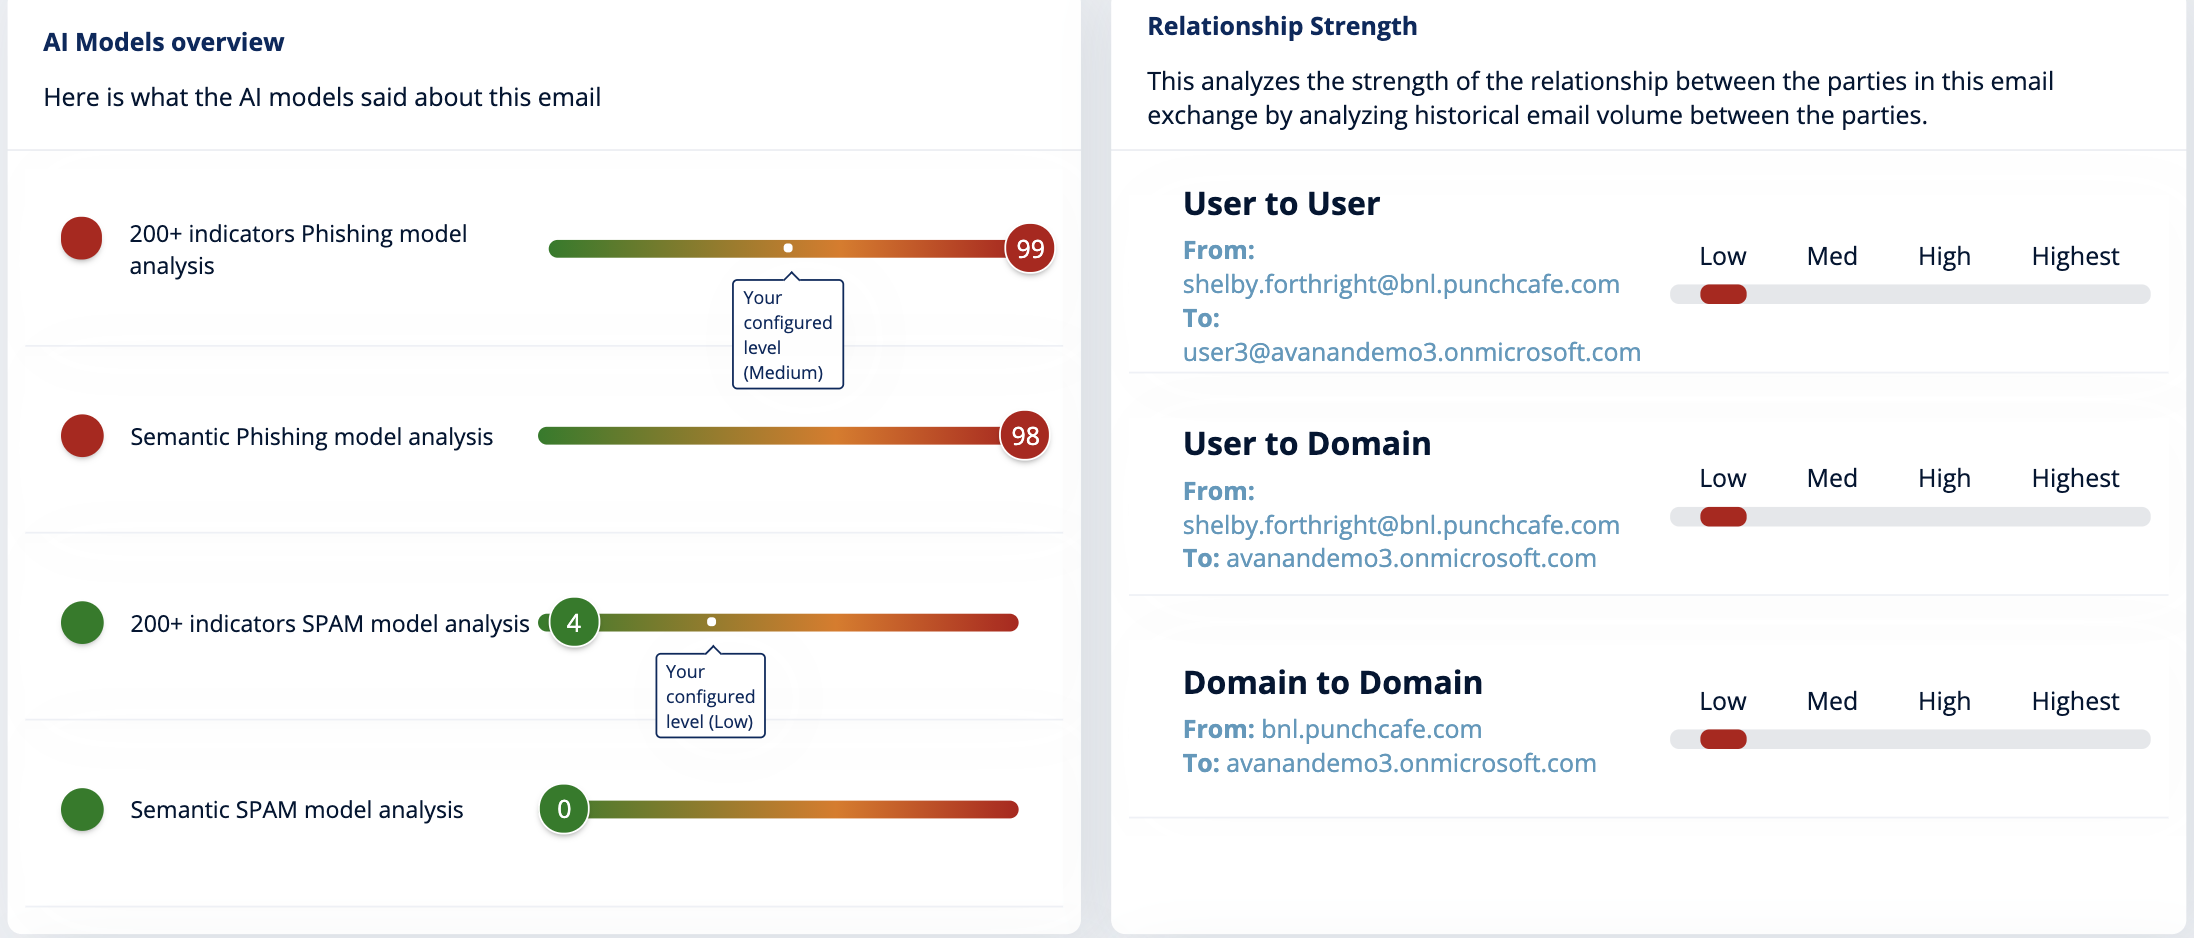
Further on, you'll see what specifically tipped off Avanan's AI. Every email is different. In this case, the semantic phishing model analysis was very high, plus there was a low relationship strength.
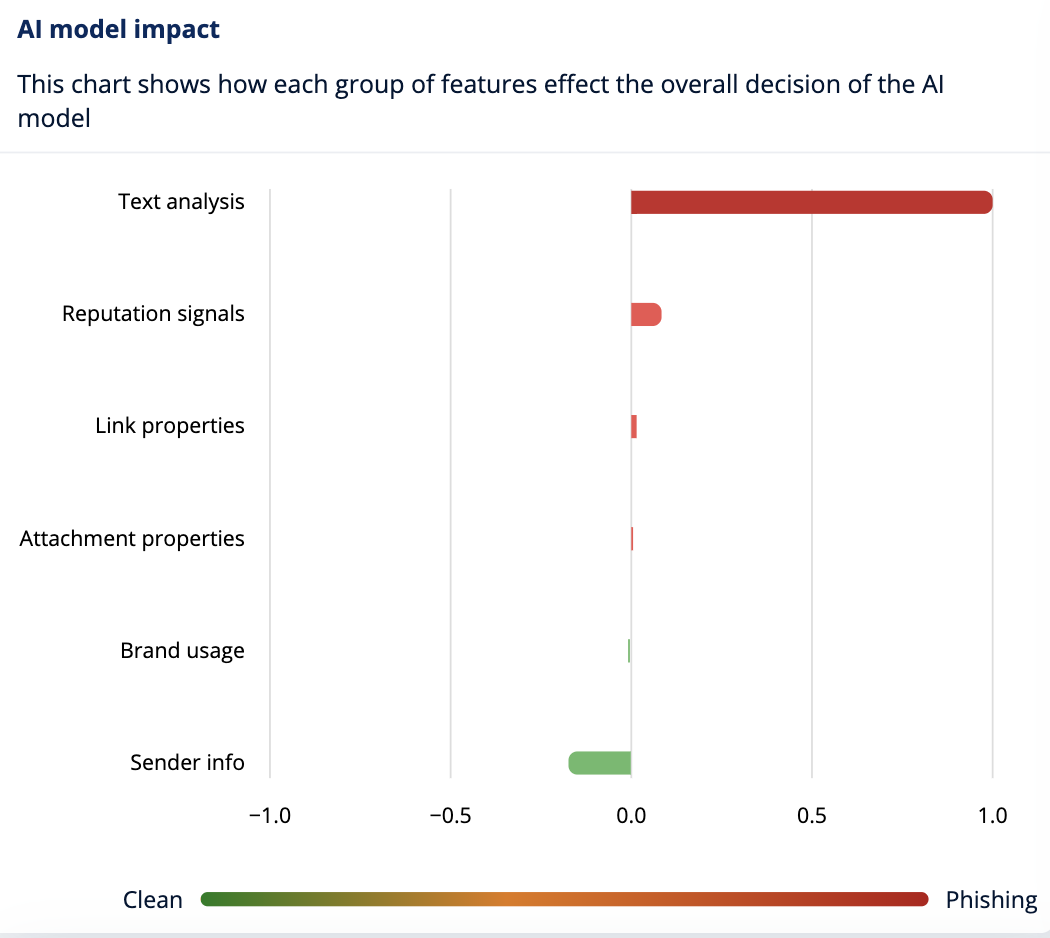
You'll see more here. Again, in this case, textual analysis tipped off the AI.
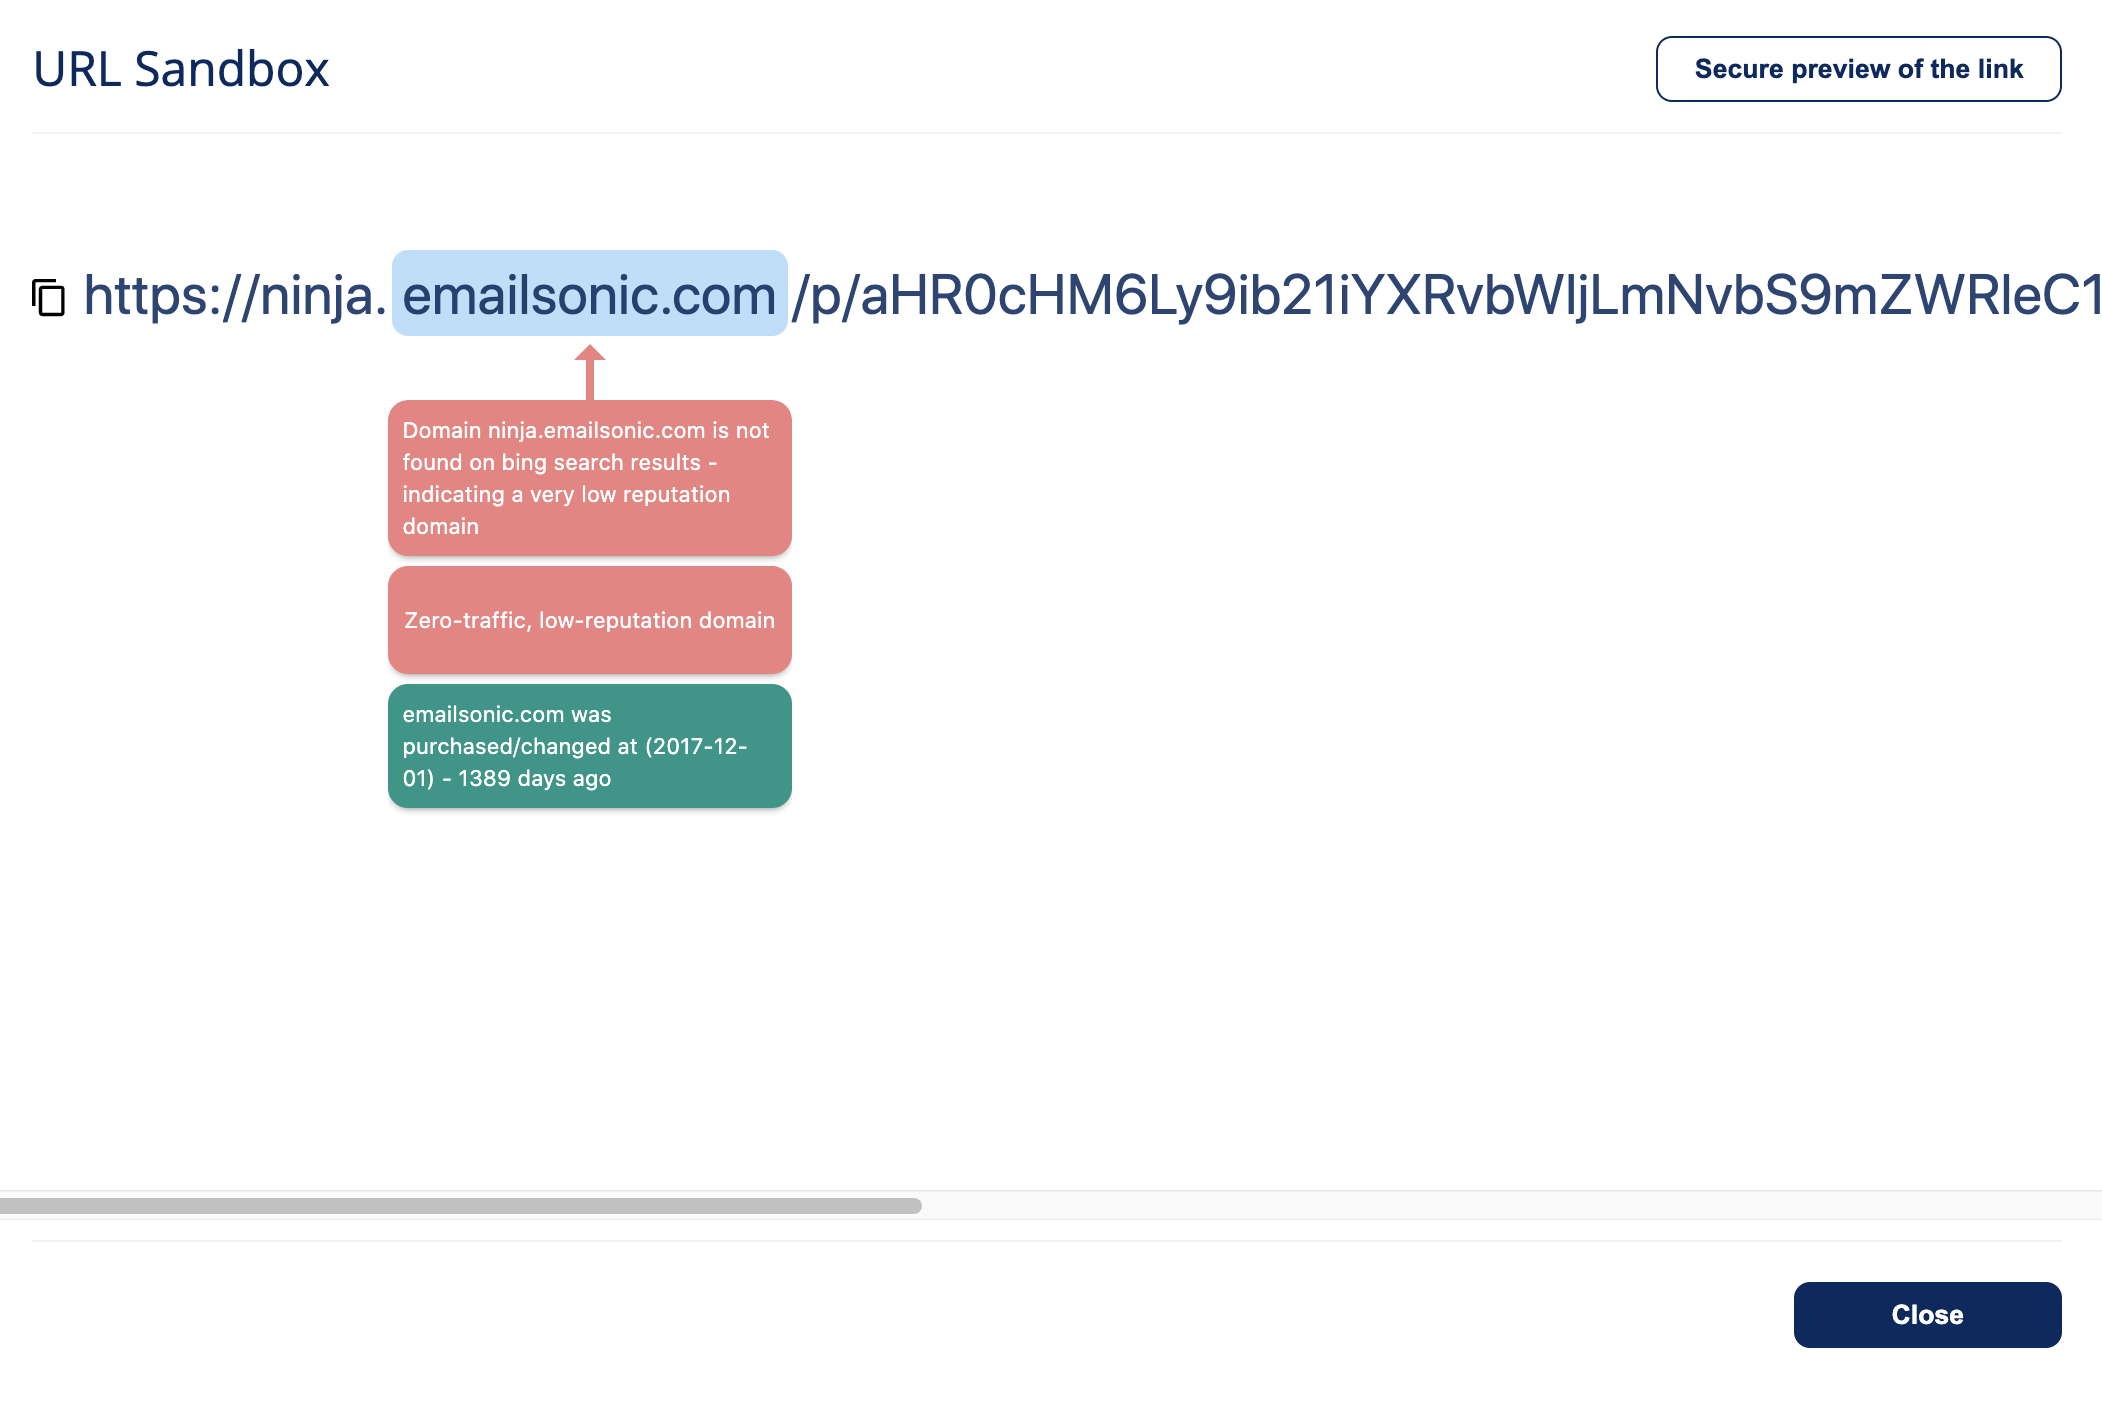
Finally, there's also URL analysis, if there are any links in the email.
Event Logs
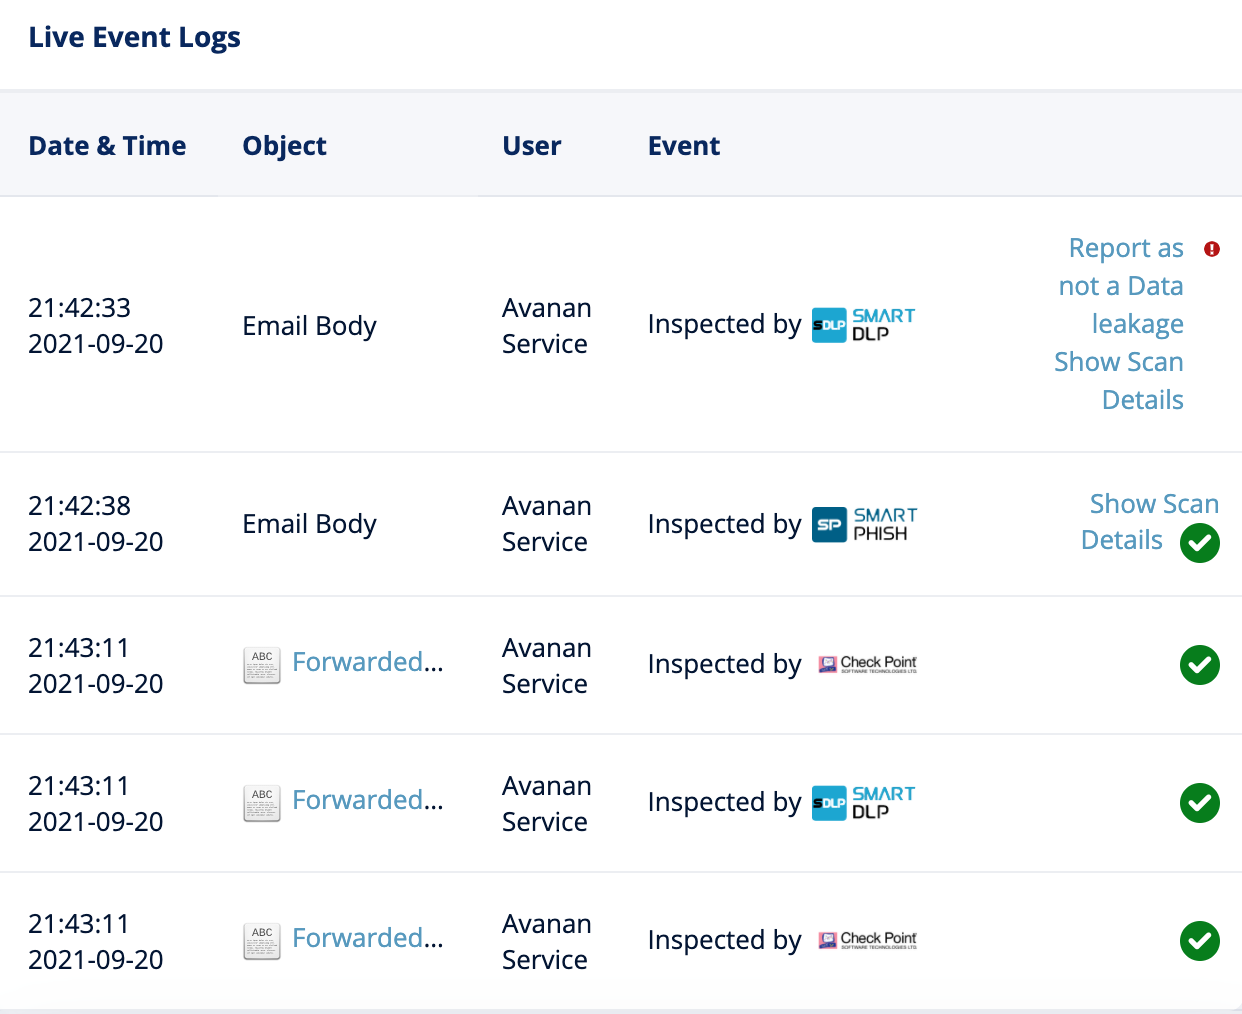
Event logs are a great way to track what's going on. You'll see, in real-time, the emails and events scanned by Avanan's layers.
Quarantined Emails
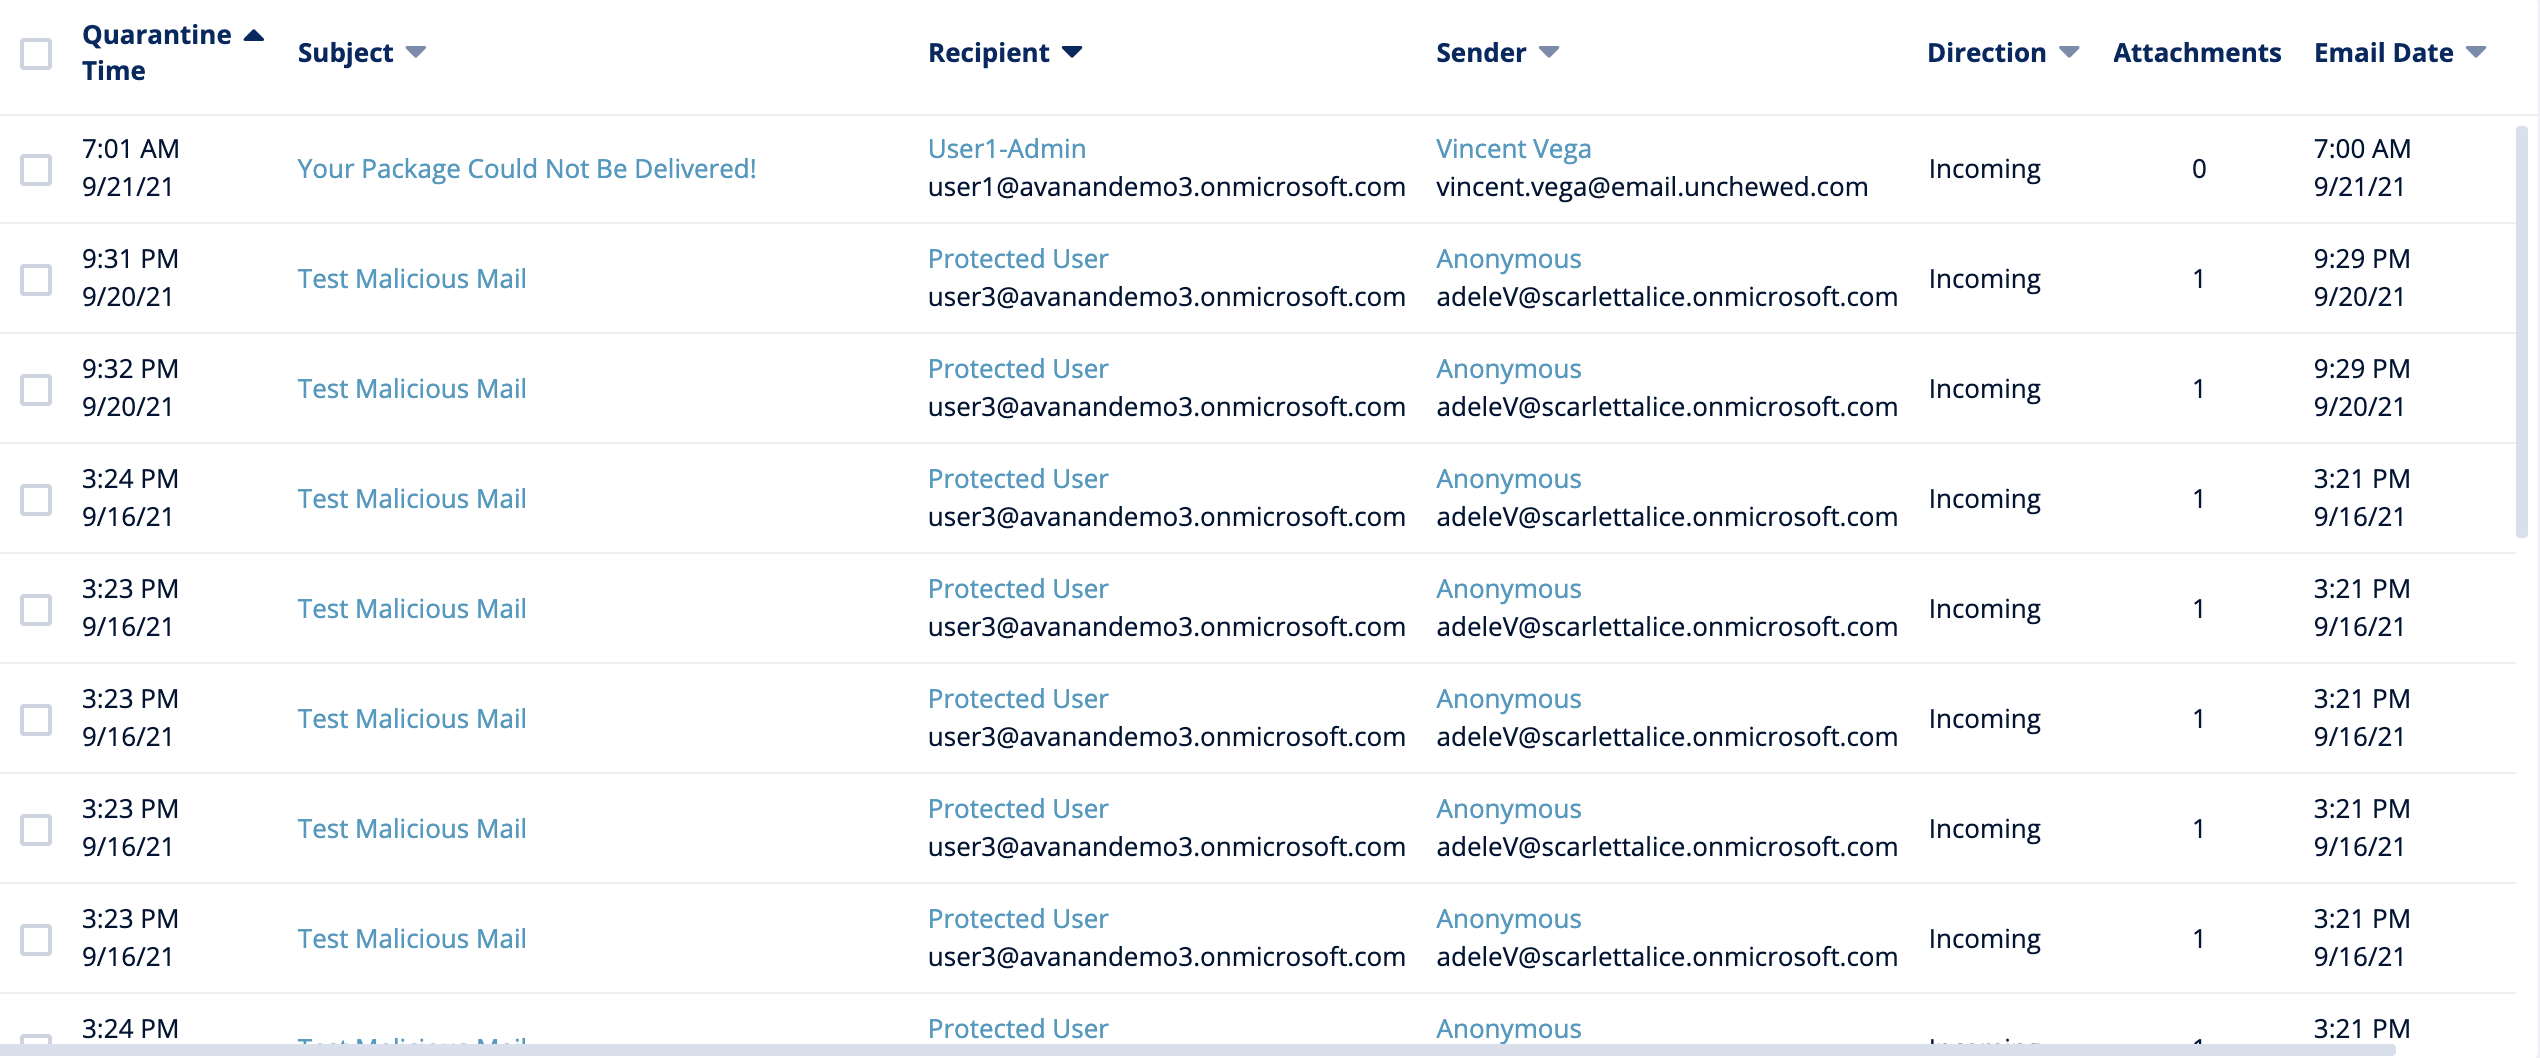
This page shows you a list of your quarantined emails.
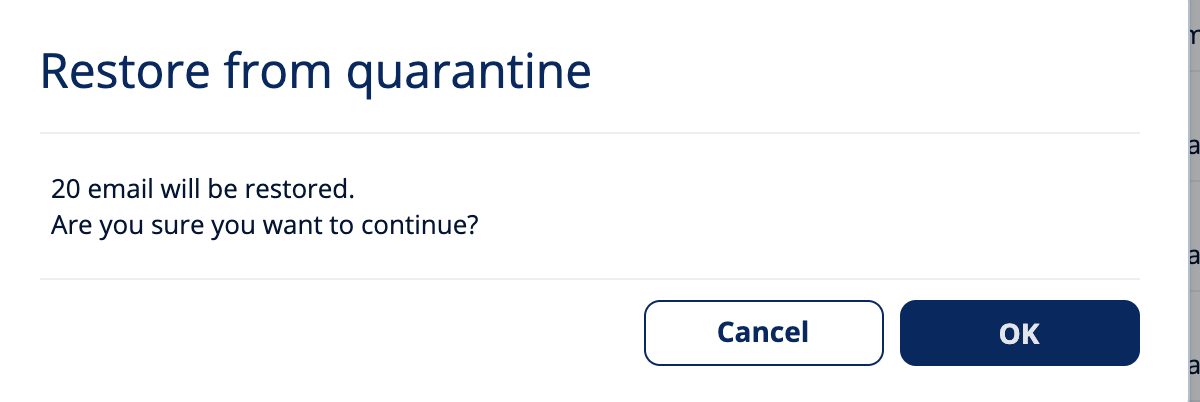
Want to release some or all? It's easy:
User-Reported Phishing
Sometimes, end-users will report an email that reaches the inbox as phishing. Depending on the policy, it will go to admins for review:

From there, admins can make a decision:

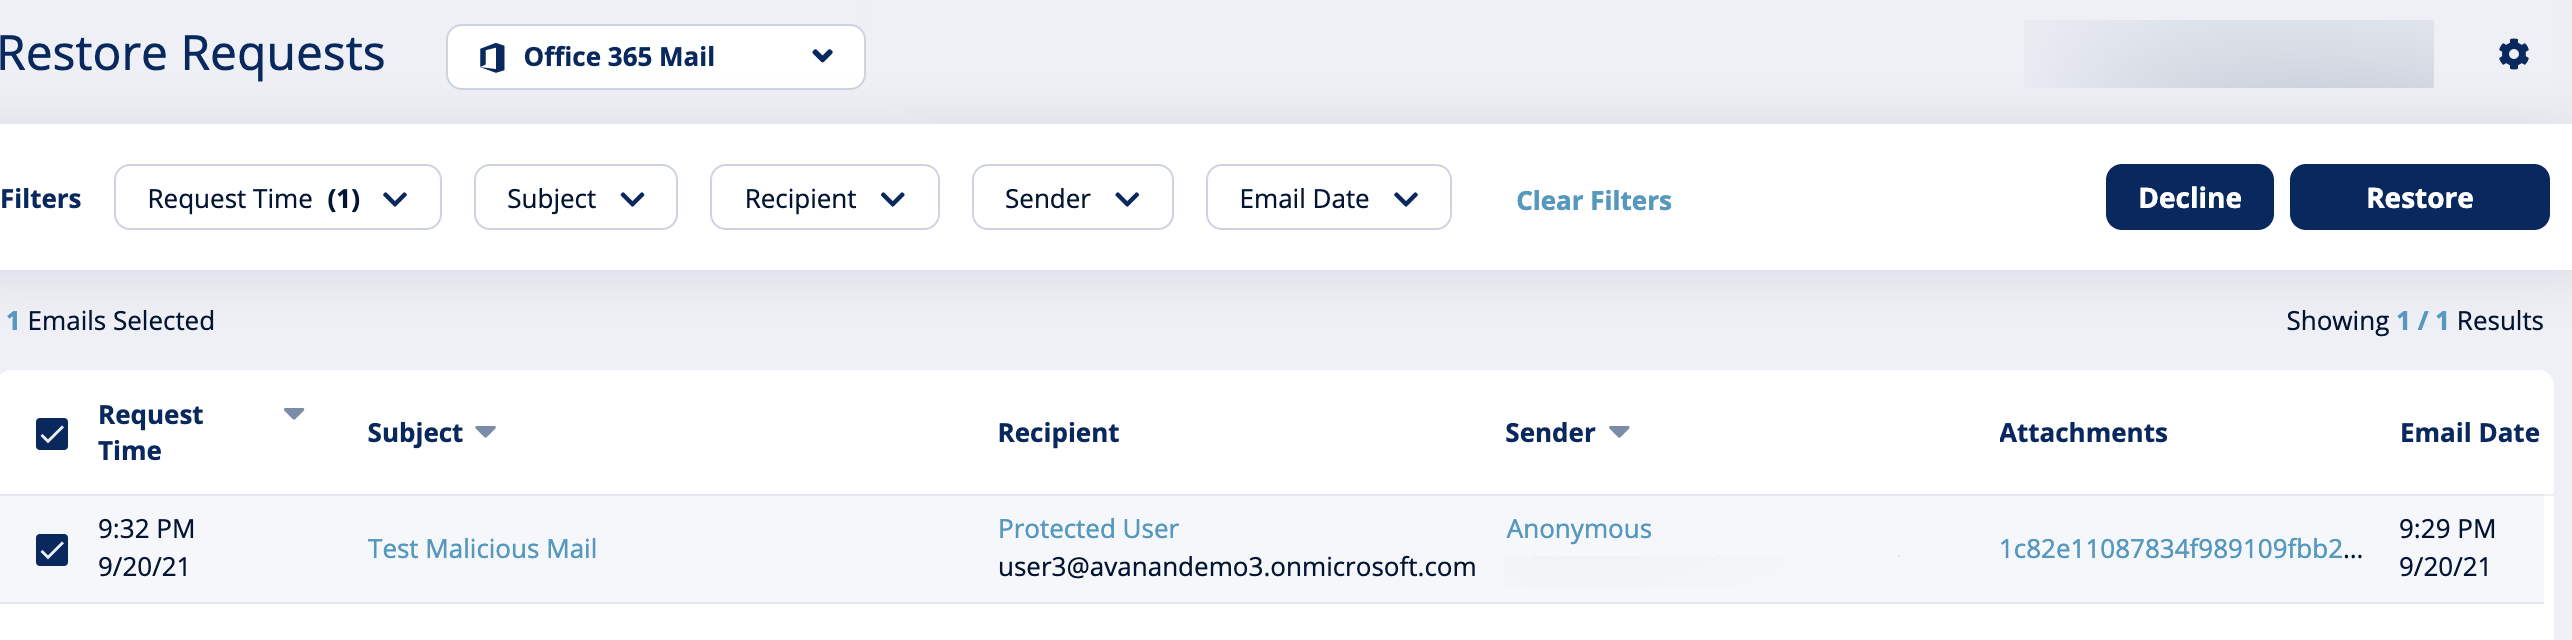
The same thing is available for restore requests.
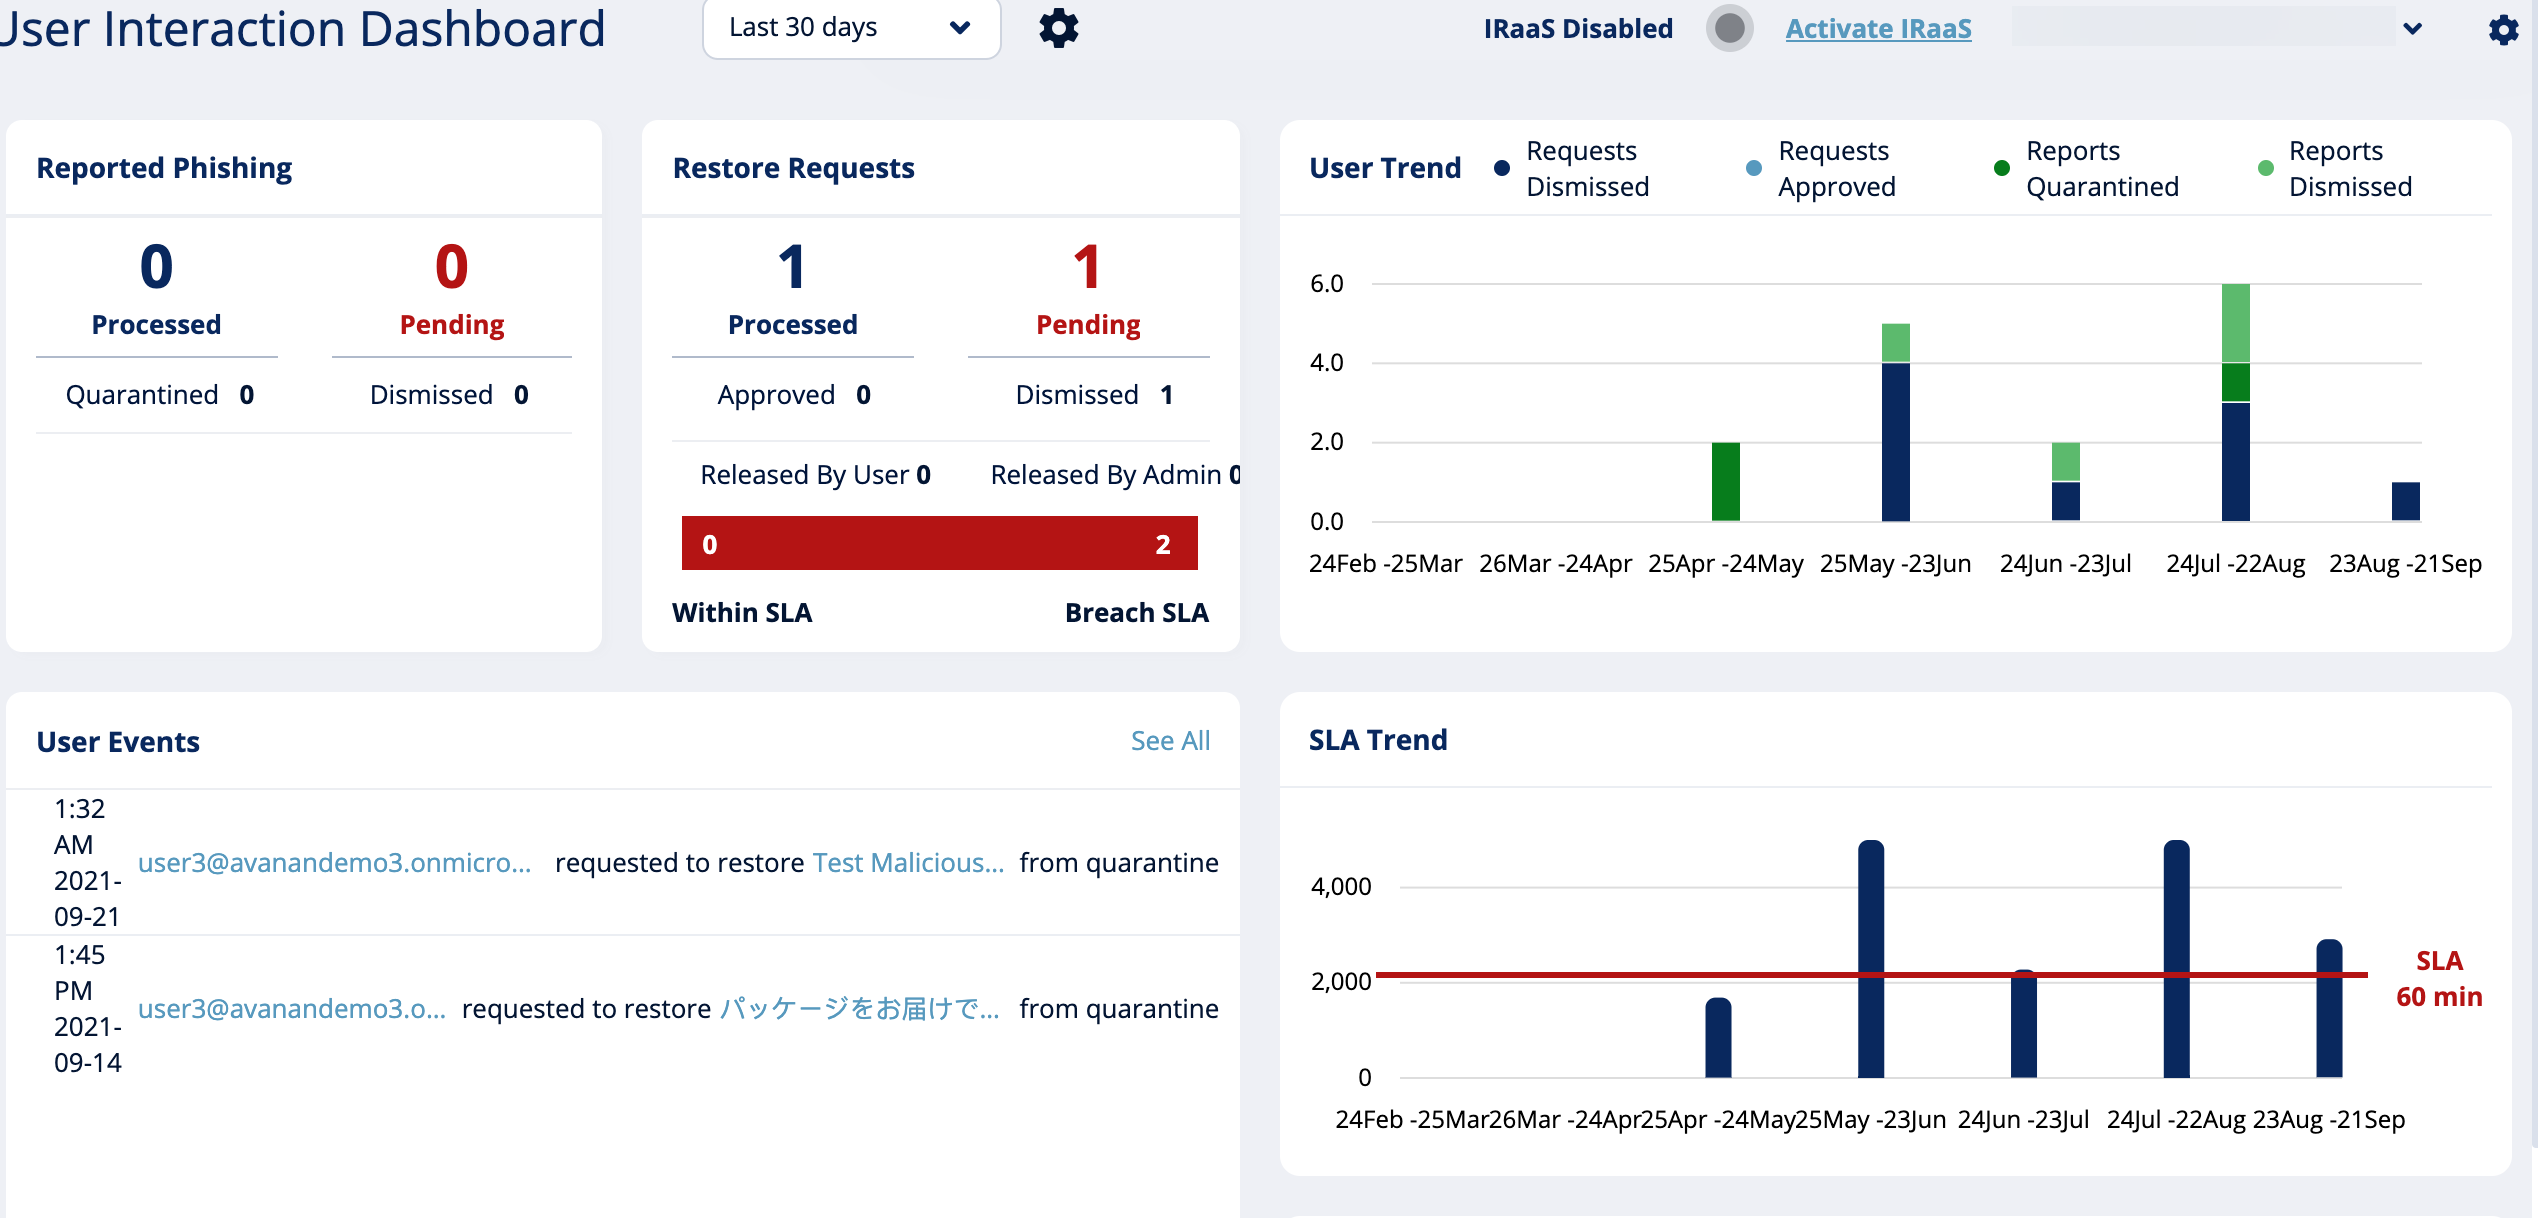
User Interaction Dashboard
A very valuable tool is the user interaction screen. This shows what users are doing with the email and how the responses to them are going. You'll see trends, numbers and more.
Avanan is infinitely customizable. Check out this video for some tips for setting up different mail policies.