

We're excited to announce a new and exciting dashboard that would revolutionize the way Email Security Teams review and measure their interaction with their email users.
Avanan makes an impact on the end-users in the organization, mainly by blocking malicious emails from reaching the inbox, or emails that contain sensitive information from being sent. Avanan offers email notifications to the users, letting them know the emails were blocked, and when allowed to do so - request to release these emails from quarantine. In addition, many organizations encourage their users to report any email they suspect to be phishing. These are touchpoints between the security team and the users - the security team offers a service to their internal 'customers'. Like any other operation, it requires measuring.
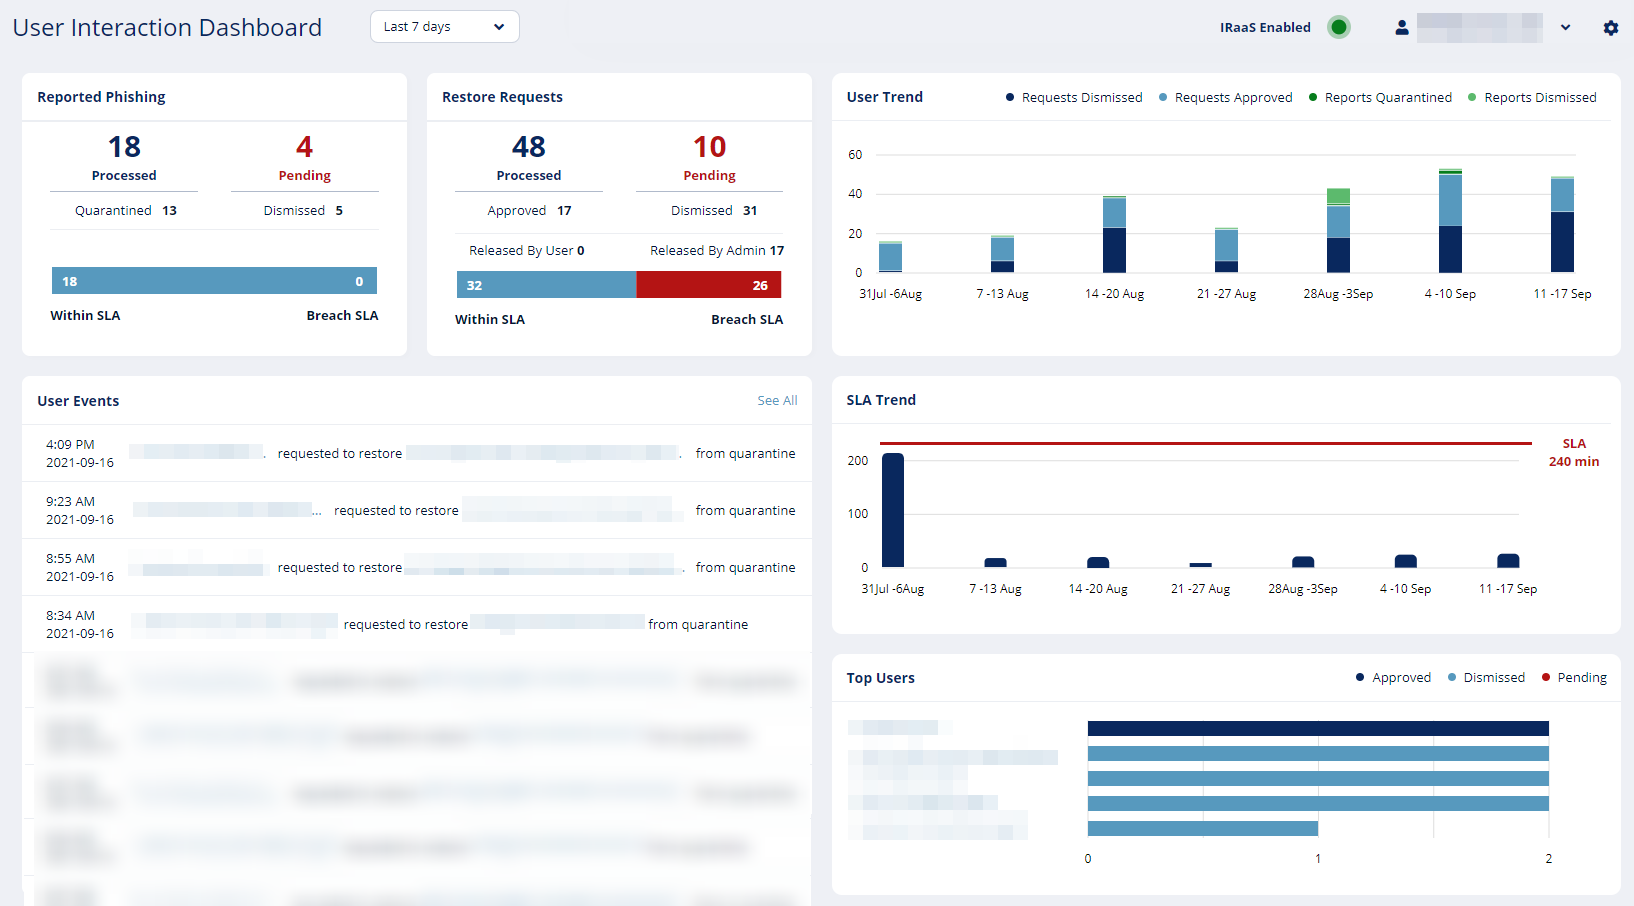
The User Interaction Dashboard offers a simple and effective view of all the requests made by the email security team (or Avanan Analysts, for IRaaS customers). It presents useful information on the requests made by the users, the actions taken by the admins, and the service quality offered by the security team. The service quality allows measuring the response time to the requests (from the moment of the request until action was taken), compared to the defined Service Level Agreement (configurable; IRaaS commits to 30 minutes). The dashboard allows selecting the relevant time frame - the last day, week, or month.
By measuring the requests and service quality, the security managers and executives can be more informed and understand the nature of the requests and security team performance: What is the actual load on the team? Are there too many false requests, generating additional load on the security team? Does the service offered by the security team meet the organization's standard? And more.
The following information is presented in the dashboard:
-
Reported Phishing: the number of reports of suspected phishing emails, with a breakdown to the number of requests processed (quarantined or dismissed by the admin) and pending, and the service quality.
-
Restore Requests: the number of reports of suspected phishing emails, with a breakdown to the number of requests processed (released or dismissed by the admin) and pending, and the service quality.
-
User requests trends: breakdown of the requests over time.
-
SLA trend: the service quality over time.
-
Top users: the users that issued most requests within the time frame.
-
Latest user events.
The User Interactions Dashboard will become available to all customers starting October 4th, 2021.